+1-480-382-1320
 +44-7428758945
 +61-1300-332-888
 +91 9811400594
Our Blogs
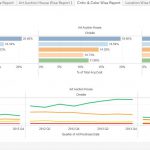
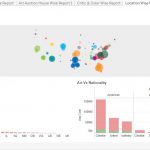
Data visualization is the act of taking data and placing it into a visual context, such as a map or graph to bring the Information out of it. Visualization also makes it easier to detect patterns, trends, and outliers in groups of data which can define the next strategy for a business.
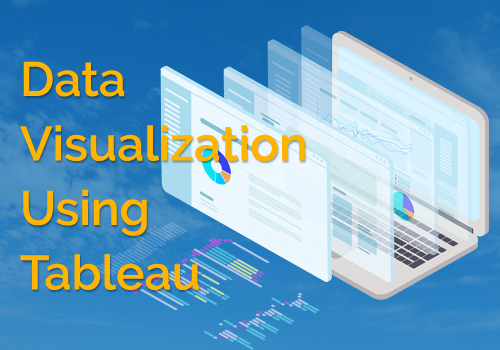
Good visualizations should extractinformation from complicated datasets so that theinformation is clear and concise. Now the question comes which Tool can we use for a better understanding of Data? The Answer is Tableau because
- Tableau has more flexible deployment options compared to Visualization Tools.
- Tableau, along with on-premises deployment also supports cloud services as well.
- Tableau connects to many different data sources and can visualize larger data sets than any other BI tool can.
- The inbuilt AI gives it more power than any other tools, through which you only needs to drag and drop the data and Tableau Engine will display the most suitable visualization for your data, which definitely you can change and customize as per your need. Also customization is way better than any other BI as it can be formatted to the slightest detail.
- Tableau is very good with creating processes and calculations. For example, while creating calculations in tableau, the formula can be typed once, stored as a field and applied to all referencing that source. This makes it easier to create and apply recurring processes. Tableau’s flexibility allows users to create custom formulas that can be applied to a filter or a field.
- Data storytelling is also one of the unique and easy to use features in Tableau which makes it different from other.
- Another major thing is Apart from Real Time data, it also allows using extract for fast retrieval and display of data which can be refreshed as per the need of the user.
About Girikon:
Girikon is a reputer provider of end-to-end IT services including Salesforce consulting, implementation and Salesforce support. Their commitment to excellence has made them a preferred choice among their customers.
About Author

Saurav is a software developer with more than 8 years of experience in Talend, Excel, Tableau, SQL, Python and R. He is also a data science enthusiast and works on different data science algorithms like Regression, linear model, Random forest and Neural network to name a few.
Share this post on: